Two methods, different questions
| Method or result | What to look for | Important limit |
|---|---|---|
| HPLC with UV detection | A chromatogram, peak list and reported area percentages | The result depends on separation, detection and integration conditions. |
| Quantification by HPLC-UV | A separately reported amount or concentration | Peak area percentage alone does not supply a calibrated quantity. |
| Mass spectrometry | Ion signals, mass values and an identity interpretation | Matching mass alone is not a complete description of every structural feature. |
LC-MS combines liquid chromatography with mass spectrometry. A report may include both UV and mass-spectrometric measurements. Read the stated method rather than assuming every certificate uses the same instrument setup. Agilent’s peptide workflow guide distinguishes purity analysis, target mass confirmation and sequence confirmation as analytical tasks.
Follow a real two-page report
The examples below come from reports already published in Aera’s lab-results archive. They are historical report examples, not a statement about current inventory or the lot in a particular order. The original laboratory and client names are retained. Ask Aera to confirm the applicable lot if you need documentation for supplied material.
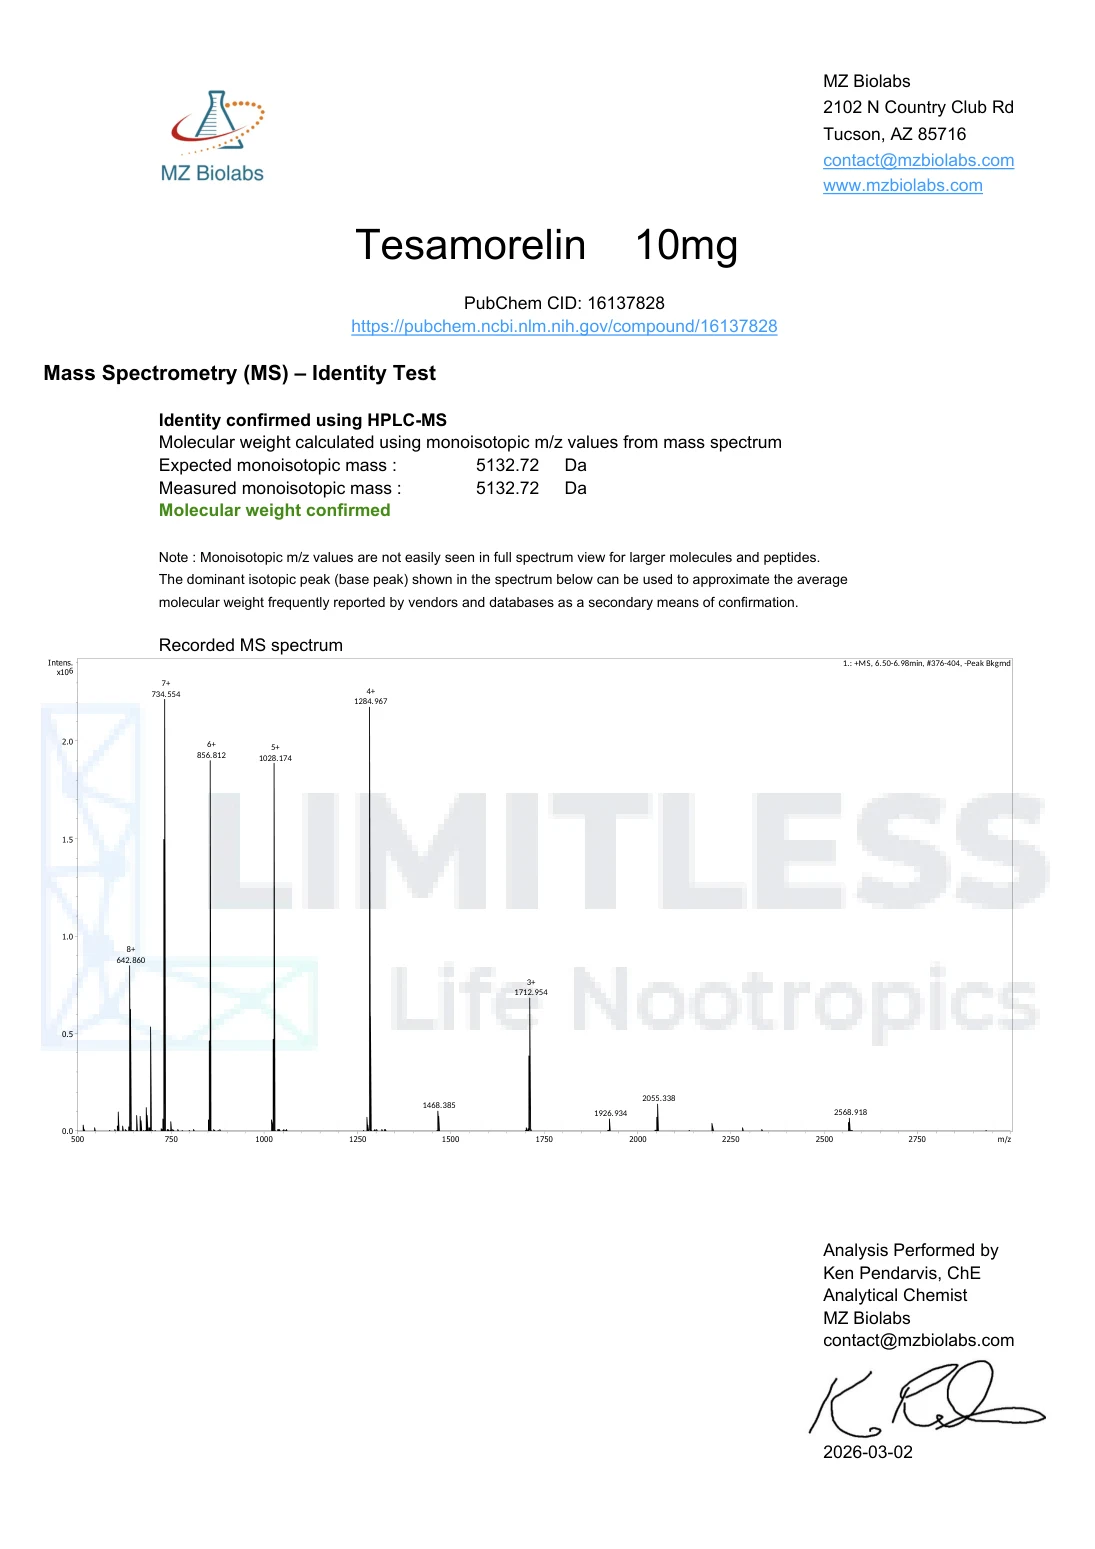
The MZ Biolabs report for Tesamorelin, USA1262 Vial 1 states HPLC-UV-MS as its method. Page one presents a UV chromatogram and quantitative results. Page two presents a recorded mass spectrum and the laboratory’s identity interpretation.
Read the chromatogram and peak list
The horizontal axis on page one shows time in minutes. The peak list assigns the main Tesamorelin peak a retention time of 6.71 minutes and an area percentage of 99.92. A second listed peak occurs at 7.03 minutes and contributes 0.08% of the listed area.
A peak’s retention time describes when it emerged under that method. Its area is part of the detector response. Neither should be interpreted without the method context. A separate quantity section reports 10.42 mg/vial, showing why a quantity result should not be replaced by an area percentage.
A chart can help a reader understand the result, but visual inspection of a small image cannot reproduce the laboratory’s integration, calibration or method validation. Use the reported values and ask the laboratory about method questions.
Read the mass spectrum without confusing its axes
Page two reports an expected monoisotopic mass of 5132.72 Da and a measured monoisotopic mass of 5132.72 Da. The laboratory states that molecular weight was confirmed. The recorded spectrum uses m/z on its horizontal axis, which is mass-to-charge ratio, not simply molecular mass.
The spectrum includes signals labelled with charge states such as 8+, 7+ and 6+. Multiple charged signals can relate to the same molecule. Counting those labelled signals as separate contaminants would be a misreading of this type of spectrum.
Understand the limits of an identity conclusion
The mass match is evidence supporting the laboratory’s reported conclusion under its method. It should not be expanded into an assertion that every possible structural distinction has been ruled out. Different analytical questions can require different or additional techniques.
Likewise, a high chromatographic purity figure does not establish sterility, an endotoxin result or suitability for human use. Those are separate questions. Keep the language of a summary within the scope of the actual document.
Do not rename another laboratory’s method
The TrustPointe BPC-157 batch 1305 report uses rows labelled TM-1006 BPC-157 ID by RT and ID by Spectral. Those labels differ from the explicit mass-spectrometry section in the MZ report. The word “spectral” alone is not enough to rename a result as LC-MS.
Preserving the original test names is a practical way to avoid overstating a certificate. If the method abbreviation is unclear, ask the issuing laboratory for an explanation. The COA guide covers the remaining fields, and purity versus content explains the numbers.
Common questions
Can HPLC alone prove peptide identity?
Retention and detector information can contribute to identification under an appropriate method. Do not infer complete identity from a purity percentage alone.
Does matching mass prove the full sequence?
A matching mass supports a particular analytical conclusion, but mass alone does not resolve every structural distinction. Read the method and the scope of the laboratory’s conclusion.
Why are there several peaks in a mass spectrum?
Signals can arise from different charge states and isotopic forms as well as other species. Several signals do not automatically mean several contaminants.
Sources and original reports
- MZ Biolabs: Tesamorelin, HPLC-UV-MS report, pages 1 and 2
- TrustPointe Analytics: batch 1305, identification row labels
- Agilent: Therapeutic Peptides Workflow Resource Guide
Report examples checked against the public files on 14 October 2026. Laboratory authorship of a source report does not imply review or endorsement of this article.